Page speed optimization is like flossing: everyone agrees it’s good, almost nobody wants to do it, and the people who actually keep up with it won’t stop talking about it.
But here’s the plot twistunlike flossing, page speed has receipts. Faster pages tend to keep users around longer, convert better, and reduce the “rage-clicking” that happens
when a site feels like it’s loading via carrier pigeon.
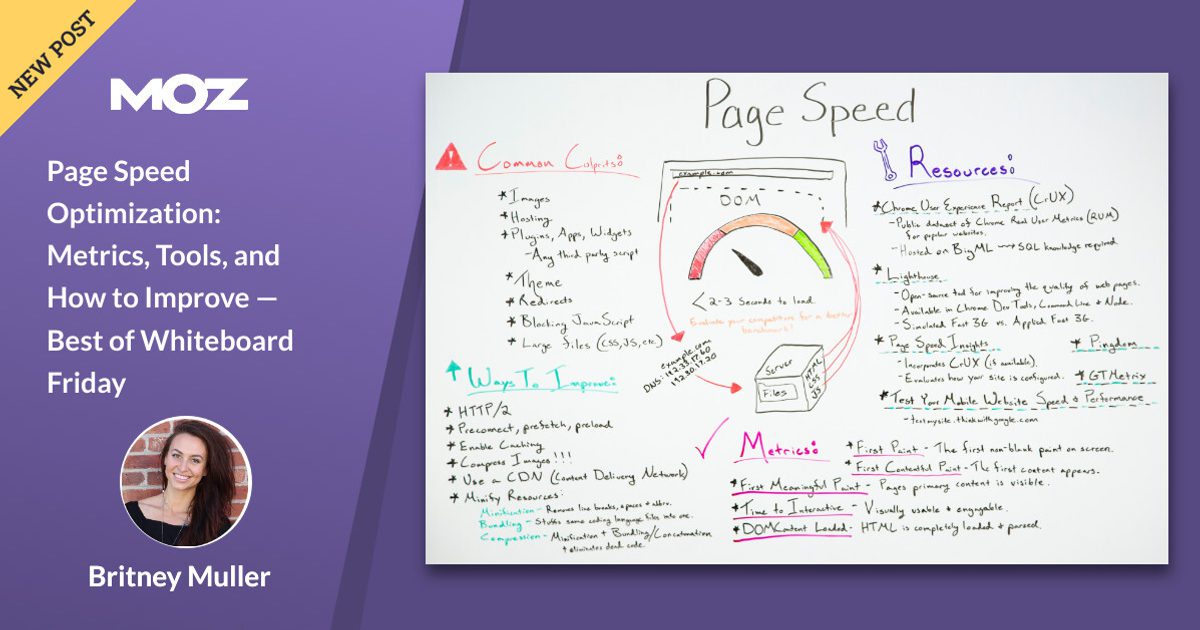
This “Best of Whiteboard Friday” topic from Moz still hits because it’s not about chasing a perfect score for bragging rights. It’s about making your site feel fast to real humans
on real devices, with real connections, while keeping Google and Bing happy enough to keep sending you traffic.
Why Page Speed Matters (Beyond “Google Said So”)
Search engines want to rank pages that satisfy users. Users want pages that don’t waste their time. That Venn diagram is basically a circle.
And the business case is brutal: a tiny delay can snowball into fewer sales and more bouncesespecially on mobile.
If you need a “show me the money” moment, performance studies in e-commerce have repeatedly highlighted how even small delays can impact conversion and bounce behavior.
Translation: milliseconds are not cute. They’re expensive.
Speed Has a Vocabulary Problem (So Let’s Fix That)
People say “my site is slow” the way they say “I’m bad at math.” It’s vague, emotional, and usually followed by someone opening a tool and yelling,
“It says 37!” (Cool. 37 what?) Speed optimization gets easier when you separate what you measure from what you fix.
Two Kinds of Data: Lab vs. Field
Lab data is a controlled test: consistent settings, simulated devices/network, repeatable results. Great for debugging.
Field data comes from real users (different phones, networks, and browser moods). Great for truth.
You need both, because lab tells you why and field tells you whether it matters to humans.
Metrics That Actually Matter
Core Web Vitals: The “Big Three”
Core Web Vitals are the headline metrics for user experience performance. They map to three feelings users have within seconds:
“Is it loaded?”, “Can I use it?”, and “Why did that button move right as I clicked it?”
- LCP (Largest Contentful Paint): how quickly the main content appears. Aim for 2.5s or less.
- INP (Interaction to Next Paint): how quickly the page responds to user interactions. Aim for under 200ms.
- CLS (Cumulative Layout Shift): how stable the layout is during loading. Aim for under 0.1.
One more detail that matters for SEO: “passing” is not about your best day. It’s about consistency. The standard approach uses the
75th percentile so you’re optimizing for the slower (but very real) slice of users, not the lucky ones on fiber internet.
Supporting Metrics (Still Useful, Just Not the Main Characters)
Core Web Vitals are the stars, but you’ll still use supporting metrics to diagnose what’s broken:
- TTFB (Time to First Byte): how fast the server starts responding. Often a bottleneck for LCP.
- FCP (First Contentful Paint): when the first content shows up (useful, but not “main content”).
- TBT (Total Blocking Time): lab proxy for input responsiveness; great for finding “JavaScript is hogging the main thread” problems.
- Speed Index: a lab-style “how quickly content appears” summary that can help compare changes.
Tools to Measure Page Speed (Without Losing Your Mind)
The toolset can feel overwhelming, so here’s a practical rule: pick one field source and one lab source, then expand only if you need more detail.
Otherwise you’ll spend your entire life comparing scores like they’re fantasy football stats.
Google PageSpeed Insights (PSI)
PSI is the “two-in-one shampoo” of performance tools: it shows field data (when available) and runs a Lighthouse lab test.
It’s especially useful for quickly spotting issues like render-blocking resources, excessive JavaScript, and image bloat.
Google Search Console: Core Web Vitals Report
Search Console groups URLs by similar performance issues and shows whether you’re “Good,” “Needs improvement,” or “Poor” for LCP, INP, and CLS.
It’s less about debugging individual files and more about prioritizing: “Where should we spend engineering time this sprint?”
Lighthouse + Chrome DevTools
Lighthouse gives you a lab score and diagnostics. Chrome DevTools lets you go deepernetwork waterfalls, CPU time, long tasks,
and what’s actually blocking rendering. Use this when you need to answer: “What exactly is causing slow LCP on this template?”
Real User Monitoring (RUM): New Relic, Datadog, and Friends
RUM tools track performance for real users over time and help you segment by device type, geography, browser, and page.
This is how you catch the “it’s fast for us in the office” trap. RUM is also how you notice regressions quicklybefore your rankings and revenue do.
Waterfall Tools: Pingdom
Waterfall charts are the X-ray machine of page speed: you can see which requests are slow, what blocks what, and where time is spent (DNS, SSL, waiting, downloading).
If you’ve ever stared at “Why is this one image taking 2.4 seconds?” and felt personally attacked, welcomeyou’re doing real performance work now.
How to Improve Page Speed: The Practical Playbook
Here’s the part Moz fans love: you don’t need to become a full-time performance engineer to make real gains.
You need a clear order of operations, because performance is a system. Fixing the wrong thing first is how people spend weeks minifying CSS
while their server is still responding like it’s booting from a floppy disk.
Step 1: Fix Server Response and Delivery (TTFB)
If your initial HTML is slow, everything is slow. Common wins:
- Use a CDN to cache and deliver content closer to users.
- Cache HTML where appropriate (especially for content pages and anonymous users).
- Reduce origin work: optimize database queries, remove heavy middleware, and cut server-side redirects.
- Use modern protocols (HTTP/2 and HTTP/3 where supported) and keep connections warm.
- Enable compression (Brotli when available) to reduce transfer sizes.
Practical benchmark: if your TTFB is frequently above ~800ms, it’s often a sign you’ll struggle to hit strong LCP consistentlyespecially on mobile.
Step 2: Make LCP Happen Faster (Prioritize the “Hero”)
LCP is usually a hero image, a headline block, or a large above-the-fold section. The goal is to make that element discoverable, fetchable, and renderable quickly.
Typical LCP killers include slow servers, render-blocking CSS, unoptimized images, and heavy JavaScript that delays rendering.
High-impact LCP fixes:
- Preload the LCP resource (often a hero image or key font).
- Inline critical CSS for above-the-fold layout; defer the rest.
- Optimize images: responsive sizes, modern formats (WebP/AVIF), and sensible compression.
- Reduce render-blocking scripts: defer non-critical JavaScript, especially third-party tags.
Example: preload a hero image (use carefullypreload only what’s truly critical):
Step 3: Improve INP (Stop JavaScript From Hogging the Main Thread)
INP punishes pages that feel “sticky” when you interactclick, tap, typeand the UI takes too long to respond.
The most common culprit is excessive JavaScript execution or long tasks blocking the main thread.
- Ship less JavaScript: remove unused libraries, cut polyfills you don’t need, and audit third-party scripts.
- Code-split aggressively: load what a page needs, not what the entire app needs someday.
- Break up long tasks: schedule work, chunk heavy computations, and consider Web Workers.
- Delay non-essential scripts until after interaction readiness.
If your site is “interactive” only after it finishes running a 900KB bundle… it’s not a website. It’s a slow-loading video game menu.
Step 4: Fix CLS (Stop Layout Jump-Scares)
CLS is what happens when the page rearranges itself after the user starts reading or clicking. It’s the web equivalent of someone
moving the stairs while you’re halfway down them. Don’t.
- Always reserve space for images, ads, embeds, and dynamic components.
- Set explicit dimensions or aspect-ratio boxes to prevent late resizing.
- Be careful with fonts: use sensible fallbacks and loading behavior to avoid big shifts.
- Avoid layout-triggering animations; prefer transform/opacity over width/height/top/left changes.
Example: reserve image space to prevent shifts:
Example: reduce font-related surprises:
Step 5: Reduce Page Weight (Because Bytes Are Still a Thing)
Even with perfect code, a 12MB page will always be slow for someone. Make payload size a first-class metric:
- Compress and convert images; consider edge image optimization for large catalogs.
- Minify CSS/JS/HTML (nice, but don’t confuse it with “done”).
- Remove unused CSS/JS (often bigger than compression gains).
- Lazy-load below-the-fold media so the critical rendering path stays lean.
Example: native lazy-loading for images (simple and effective):
Step 6: Make Performance Stick (Monitoring + Guardrails)
Performance is not a one-time project. It’s a habitlike cleaning your kitchen, except the kitchen is your JavaScript bundle,
and it keeps inviting friends over (third-party tags) who leave crumbs everywhere.
- Track Core Web Vitals over time with Search Console plus a RUM tool.
- Alert on regressions (e.g., LCP jumps on key templates after a deploy).
- Set budgets: maximum JS per route, maximum image weight above the fold, maximum third-party scripts.
- Test before release: Lighthouse in CI, synthetic monitoring for top pages, and real-user trends after launch.
A No-Nonsense Checklist (Print This, Tape It to Someone’s Monitor)
- Measure field + lab. Don’t optimize blind.
- Fix TTFB first if it’s consistently high.
- Identify the LCP element (it’s usually obvious once you look).
- Preload only truly critical assets; defer the rest.
- Reduce JavaScript and break up long tasks for INP.
- Reserve space for images/ads/embeds to stop CLS.
- Optimize images (size, format, delivery) and lazy-load below-the-fold media.
- Monitor continuously; prevent regressions with budgets and alerts.
Conclusion
Page speed optimization isn’t about “winning” Lighthouse. It’s about shipping a site that feels quick, stable, and responsive to real people.
Core Web Vitals give you the north star (LCP, INP, CLS). Tools like PageSpeed Insights, Search Console, Lighthouse, Pingdom waterfalls, and RUM platforms
show you what’s happening. And the fix listCDN, caching, compression, image optimization, JavaScript discipline, and layout stabilityturns “slow site” into “smooth experience.”
If you take one thing from the Moz Whiteboard Friday spirit: treat performance like a product feature. Because your users already do.
They just express it by leaving.
Field Notes: Real-World Page Speed Experiences
In the real world, page speed optimization rarely starts with a clean, scientific hypothesis. It starts with someone saying,
“Traffic is fine, but conversions are weird,” followed by the quiet realization that the homepage loads fast… and every money page loads like a haunted house.
One common pattern: teams obsess over the Lighthouse score on the homepage, then ignore category pages, product pages, and blog templates where users actually land.
When you finally test those pages, the LCP element is often a massive hero image pulled from a CMS with no resizing rules.
The fix isn’t glamorousit’s creating responsive image variants, serving modern formats, and preloading the hero only when it truly is the LCP.
Suddenly, LCP drops, bounce rate calms down, and the design team stops blaming “SEO” for everything.
Another frequent storyline: a site feels “fine” on desktop, but mobile users act like they’re speedrunning the back button.
Field data tells the truthslower networks + lower-end CPUs turn “reasonable” JavaScript into a main-thread traffic jam.
The biggest INP wins often come from unsexy work: removing third-party tags that nobody can justify, splitting bundles so pages load only what they need,
and postponing non-essential scripts until after the page is usable. The surprising part is how often this improves UX and reliability:
fewer scripts means fewer random failures, fewer layout shifts, and fewer late-loading surprises.
CLS problems are usually the most annoying because they feel like a design bug but behave like a physics experiment.
Ads load late, cookie banners slide in, images expand when they download, and suddenly the page is doing interpretive dance.
The consistent fix is “reserve space, reserve space, reserve space.” Give ads a container with a predictable height.
Add width/height or aspect ratio boxes to images and embeds. If you’re using a fancy UI library, make sure skeleton states match final component dimensions.
CLS improves, and user trust improves along with itbecause nothing screams “this site is chaotic” like a button teleporting at click time.
TTFB issues tend to be where performance becomes a team sport. SEO can’t “optimize” a slow database query with a clever title tag.
The most practical improvements often involve better caching strategy, a CDN in front of the origin, and eliminating server-side work for anonymous traffic.
When teams add monitoringespecially RUMthey stop arguing about feelings and start seeing patterns:
“Checkout is slower in the evenings,” “blog posts are fine but landing pages spike TTFB,” “mobile Safari has worse INP.”
That visibility changes how organizations ship features: performance becomes a requirement, not a regret.
The best “experience lesson” is simple: the fastest sites don’t do one magic trick. They stack small wins, keep performance budgets,
and treat speed regressions like bugs. The web is always changingyour scripts, your content, your fonts, your ad partnersso a one-time speed sprint
won’t hold. But a lightweight workflow of measurement, prioritization, fixes, and monitoring? That scales.