Mean, median, and mode sound like three tiny math goblins guarding the gate to statistics. Thankfully, they are much friendlier than they look. These three values help you summarize a set of numbers so you can understand what is “typical,” what sits in the middle, and what shows up most often.
Whether you are studying for a statistics quiz, checking survey results, comparing test scores, or trying to understand why your family’s “average” pizza consumption is suspiciously high on Fridays, learning how to find mean, median, and mode is one of the most useful math skills you can build.
What Are Mean, Median, and Mode?
Mean, median, and mode are called measures of central tendency. That is a fancy way of saying they help describe the center or typical value of a data set. A data set is simply a collection of numbers, such as test scores, ages, prices, temperatures, or the number of unread emails you are pretending not to see.
Mean
The mean is the average. To find it, add all the numbers together and divide by how many numbers there are. The mean is helpful when your data values are fairly balanced and there are no extreme numbers pulling the result too far in one direction.
Median
The median is the middle value after the numbers are arranged from smallest to largest. If there are two middle numbers, you find their average. The median is especially useful when the data has an outlier, which is a value much higher or lower than the rest.
Mode
The mode is the number that appears most often. A data set can have one mode, more than one mode, or no mode at all. The mode is useful when you want to identify the most common value, such as the most popular shoe size, survey answer, or score.
How to Find Mean, Median, and Mode: 7 Steps
Step 1: Write Down the Data Set Clearly
Before you do any calculations, write the numbers neatly. This sounds simple, but messy data is where many mistakes sneak in wearing tiny math disguises.
For example, suppose you have these quiz scores:
78, 85, 90, 85, 92, 76, 88
This is your data set. Count the values, check for missing numbers, and make sure you copied everything correctly. In this example, there are seven numbers.
Step 2: Arrange the Numbers From Smallest to Largest
Ordering the numbers is essential for finding the median and helpful for spotting the mode. Put the data set in ascending order:
76, 78, 85, 85, 88, 90, 92
Now the data is easier to read. You can see the low value, high value, repeated values, and middle position more clearly.
Step 3: Find the Mean by Adding and Dividing
To find the mean, add all the numbers:
76 + 78 + 85 + 85 + 88 + 90 + 92 = 594
Then divide by the number of values. There are seven values:
594 ÷ 7 = 84.857…
Rounded to one decimal place, the mean is 84.9.
So, the average quiz score is about 84.9. Not bad. The data set deserves a tiny round of applause.
Step 4: Find the Median by Locating the Middle
The ordered data set is:
76, 78, 85, 85, 88, 90, 92
There are seven numbers, which is an odd amount. That means the median is the single middle number. Count inward from both sides:
76, 78, 85, [85], 88, 90, 92
The median is 85.
When the number of values is odd, finding the median is usually straightforward. Put the values in order, find the one in the center, and try not to overthink it.
Step 5: Handle an Even Number of Values Correctly
Now let’s try a data set with an even number of values:
12, 15, 18, 20, 22, 25
There are six numbers, so there are two middle values:
12, 15, [18, 20], 22, 25
To find the median, add the two middle numbers and divide by 2:
18 + 20 = 38
38 ÷ 2 = 19
The median is 19. Notice that the median does not have to be one of the original numbers in the data set. It simply represents the midpoint.
Step 6: Find the Mode by Counting Repeated Values
Return to the quiz score data:
76, 78, 85, 85, 88, 90, 92
The number 85 appears twice. Every other number appears once. Therefore, the mode is 85.
Here are the possible mode situations:
- One mode: 2, 3, 3, 4, 5 has a mode of 3.
- Two modes: 1, 1, 2, 3, 3 has modes of 1 and 3.
- No mode: 4, 5, 6, 7 has no mode because no number repeats.
The mode is especially useful for categorical or repeated data. For example, if a store sells more medium shirts than any other size, “medium” is the mode.
Step 7: Compare the Results and Choose the Best Summary
For the quiz scores, we found:
- Mean: 84.9
- Median: 85
- Mode: 85
These numbers are close together, which suggests the data is fairly balanced. But that does not always happen.
Consider this data set of weekly allowances:
10, 12, 12, 13, 14, 100
The mean is:
10 + 12 + 12 + 13 + 14 + 100 = 161
161 ÷ 6 = 26.8
The median is the average of 12 and 13:
12.5
The mode is:
12
In this case, the mean is much higher because of the outlier, 100. The median gives a better sense of the typical allowance because it is not pulled upward as dramatically by the unusually large value.
Mean vs. Median vs. Mode: Which One Should You Use?
Choosing between mean, median, and mode depends on what you want to understand. Each measure answers a slightly different question.
Use the Mean When You Want the Average
The mean works well when the numbers are evenly distributed. For example, if five students scored 80, 82, 85, 87, and 90 on a test, the mean gives a useful picture of the group’s performance. There are no wild values trying to hijack the calculation.
Use the Median When Outliers Are Present
The median is usually better when the data includes extreme values. This is why median household income is often more useful than mean household income. A few extremely high incomes can raise the mean, making the “average” look higher than what most people actually experience.
Use the Mode When You Want the Most Common Value
The mode is best when frequency matters. It can help answer questions like: What is the most common rating? Which product size sells most often? What score appeared the most on a test? If you care about popularity or repetition, the mode is your math buddy.
Detailed Example: Finding All Three Measures
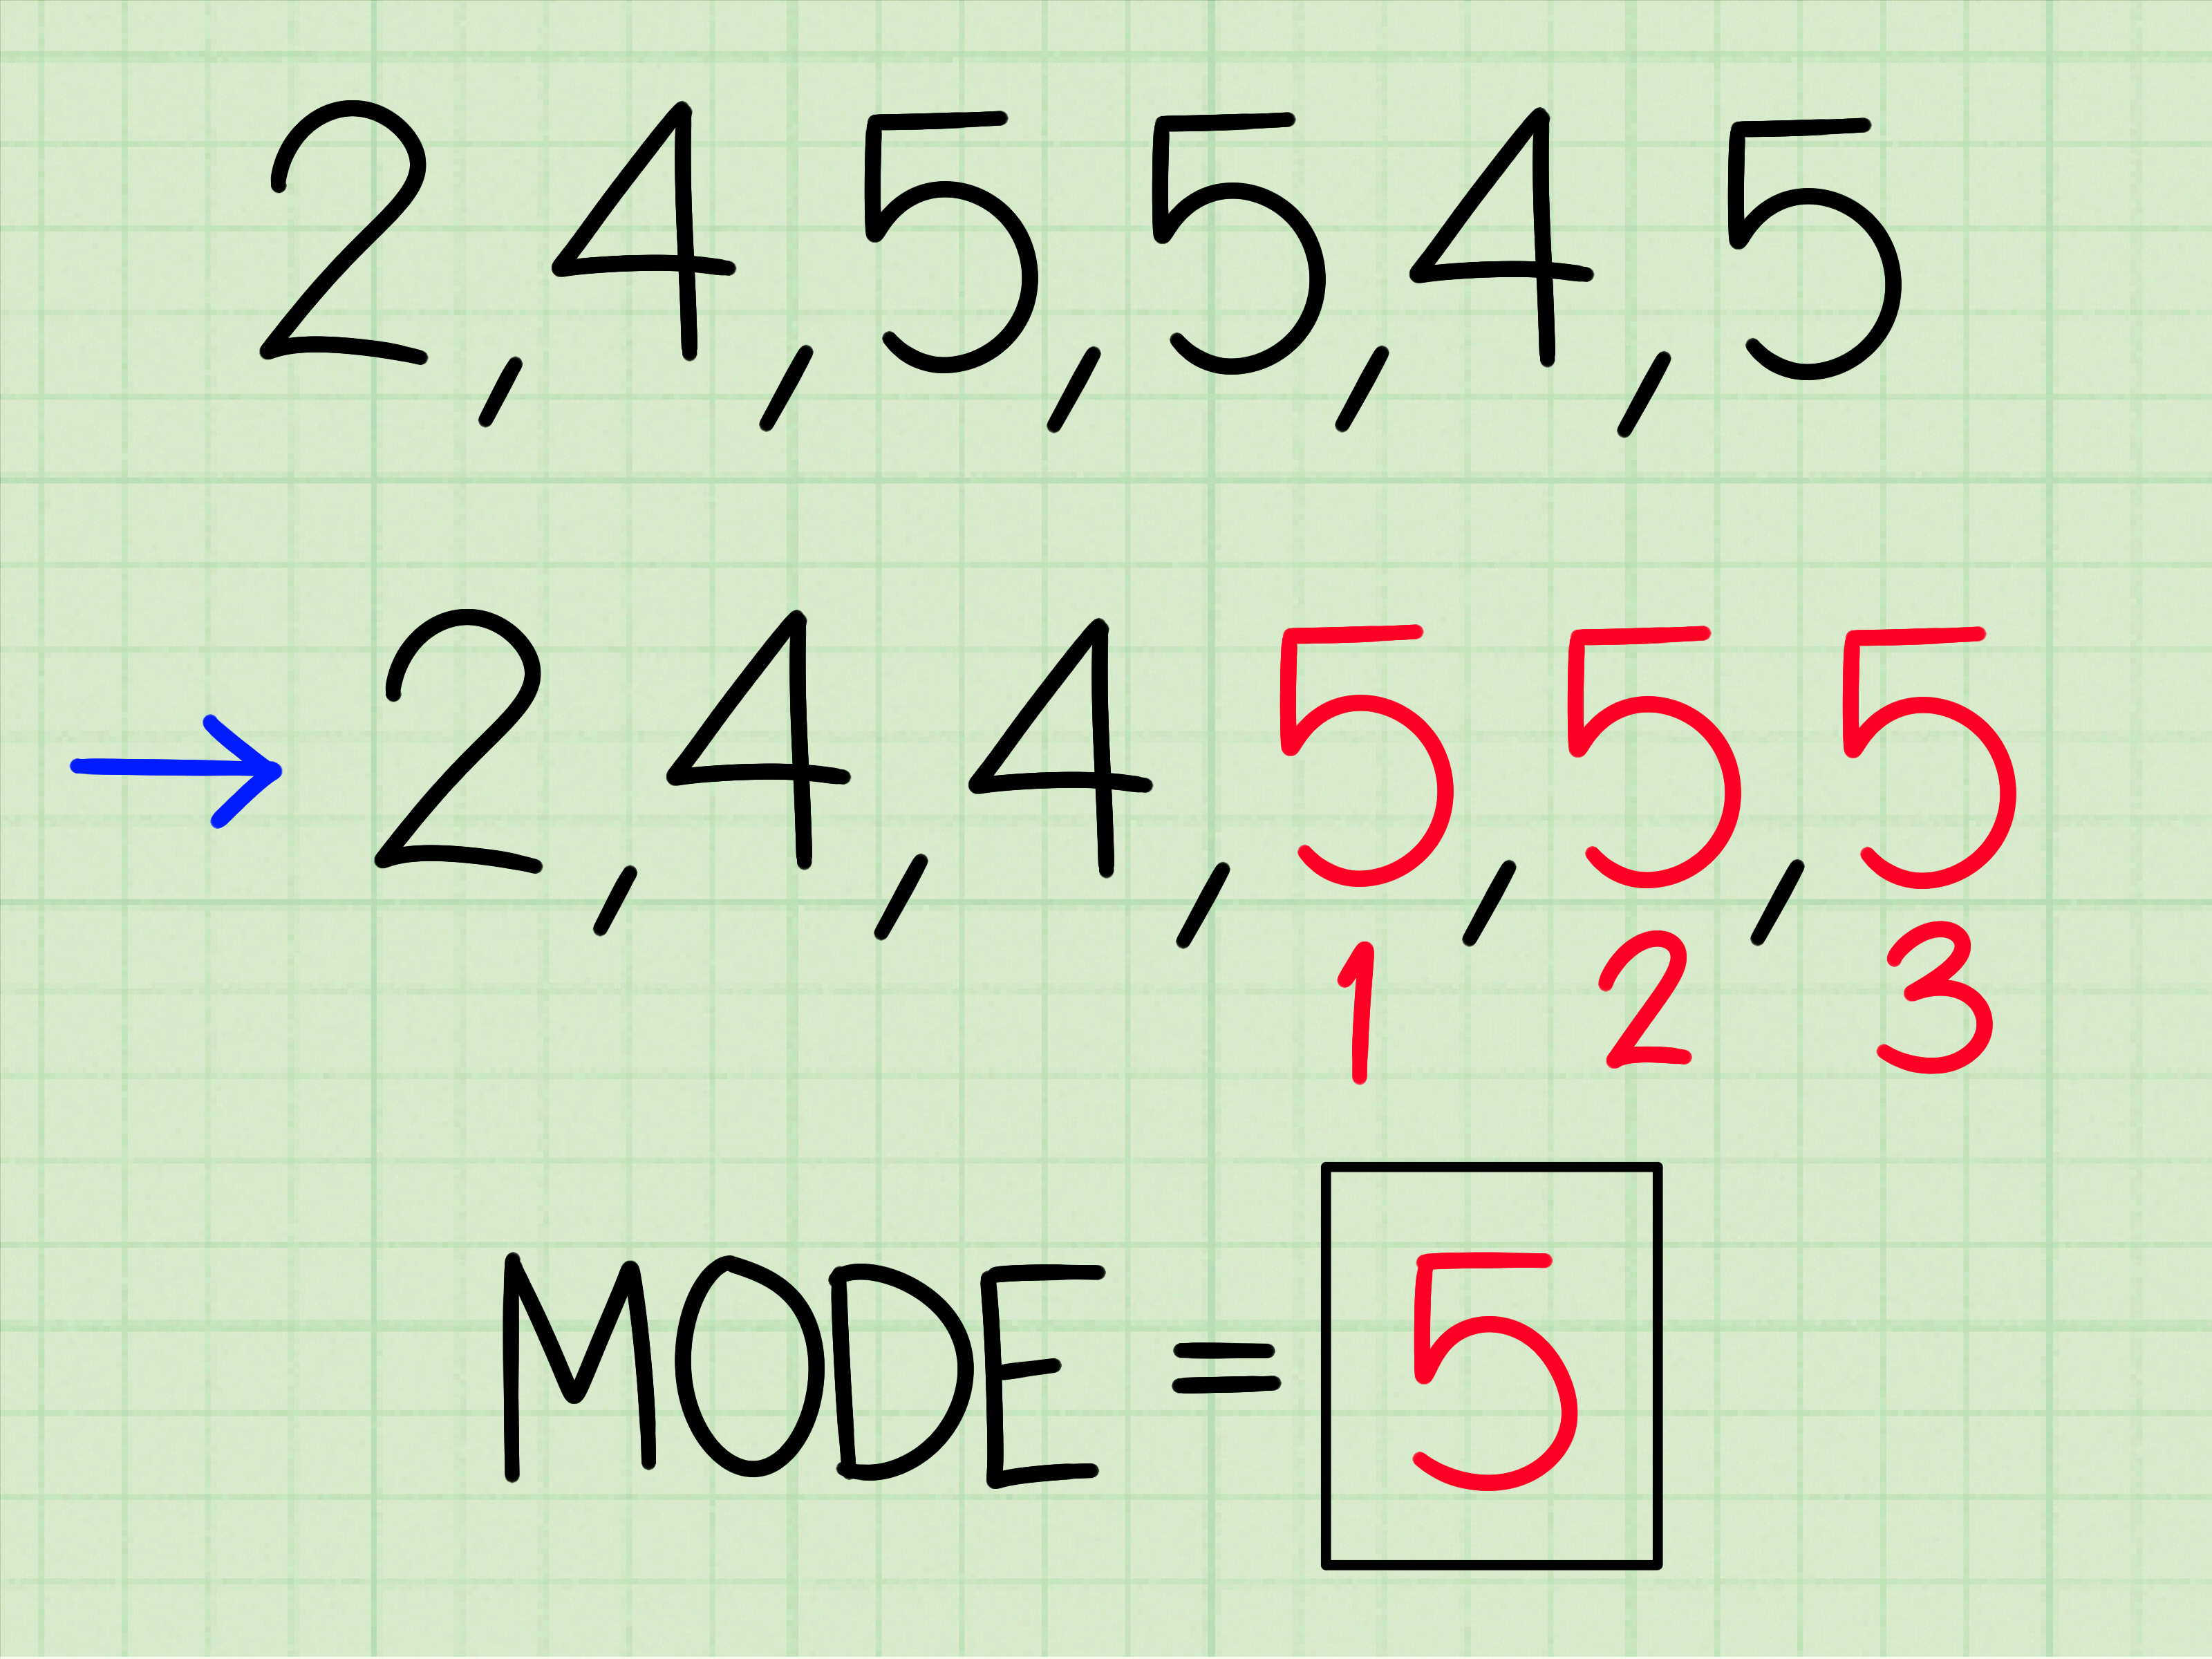
Let’s work through one complete example. Suppose a teacher records the number of books read by eight students in one month:
3, 5, 4, 6, 5, 7, 2, 8
Order the Data
2, 3, 4, 5, 5, 6, 7, 8
Find the Mean
Add the values:
2 + 3 + 4 + 5 + 5 + 6 + 7 + 8 = 40
Divide by 8:
40 ÷ 8 = 5
The mean is 5.
Find the Median
There are eight values, so find the two middle numbers:
2, 3, 4, [5, 5], 6, 7, 8
Average the two middle numbers:
5 + 5 = 10
10 ÷ 2 = 5
The median is 5.
Find the Mode
The number 5 appears twice. All other values appear once. The mode is 5.
In this example, mean, median, and mode are all equal to 5. When that happens, the data is often nicely balanced around the center. It is the math version of everything lining up perfectly on a shelf.
Common Mistakes to Avoid
Forgetting to Order the Numbers
The most common median mistake is trying to find the middle before arranging the values. The median only works correctly when the numbers are sorted from smallest to largest.
Dividing by the Wrong Number
When finding the mean, divide by the number of values, not by the largest number or by the sum of repeated values. Count carefully, especially when the data set is long.
Assuming Every Data Set Has a Mode
A data set does not always have a mode. If no number repeats, there may be no mode. If several values appear equally often, there may be more than one mode.
Ignoring Outliers
Outliers can make the mean misleading. If your data includes one number that is much larger or smaller than the others, compare the mean and median before deciding which one best represents the data.
Why Mean, Median, and Mode Matter in Real Life
Mean, median, and mode are not just classroom exercises. They show up in real decisions every day. Teachers use them to understand test scores. Businesses use them to study sales patterns. Sports analysts use them to compare player performance. Scientists use them to summarize measurements. Even weather reports rely on statistical summaries to describe temperature, rainfall, and trends.
Imagine a small coffee shop tracking how many drinks it sells each morning: 95, 100, 98, 102, 250. The mean is 129, but that does not represent a normal morning very well because one unusually busy day pushed the average upward. The median, 100, gives a more realistic picture of a typical morning. Meanwhile, if the shop records drink sizes sold and “large” appears most often, the mode tells the owner what customers prefer.
This is why understanding all three measures matters. The mean gives balance, the median gives resistance to extreme values, and the mode gives popularity. Together, they help turn a pile of numbers into a story that makes sense.
Extra Experience: Practical Lessons From Working With Mean, Median, and Mode
One of the best ways to understand mean, median, and mode is to use them with everyday data instead of only textbook examples. Textbook numbers are polite. They line up neatly, behave themselves, and rarely cause drama. Real-life numbers, on the other hand, sometimes walk into the room wearing roller skates.
For example, imagine helping a student compare weekly study time. The numbers are 2, 3, 3, 4, 4, 5, and 20 hours. At first, the mean seems impressive because the total is 41 hours and the average is about 5.9 hours. But the student knows the 20-hour week happened right before a major exam. It was unusual. The median, 4, gives a more realistic picture of normal study habits. This kind of experience teaches an important lesson: the mean is useful, but it can be overly sensitive to extreme values.
The mode also becomes more meaningful when you connect it to real situations. Suppose a small bakery records how many chocolate chip cookies customers buy per order: 1, 2, 2, 2, 3, 4, 4, 6. The mode is 2, which tells the bakery that two-cookie orders are the most common. That might help the owner create a “two-cookie snack pack.” The mean and median are helpful, but the mode gives a direct clue about customer behavior.
Another useful experience is checking whether the three measures tell the same story. If the mean, median, and mode are close together, the data may be fairly balanced. If they are far apart, something interesting is happening. Maybe there is an outlier. Maybe the data is skewed. Maybe the sample size is too small. In statistics, differences are not always mistakes; sometimes they are clues.
When teaching this topic, a simple classroom trick is to use objects instead of abstract numbers. Give students sticky notes with numbers written on them and ask them to physically line up from smallest to largest. The person in the middle becomes the median. Then everyone adds their values to find the mean, and repeated numbers reveal the mode. Suddenly, statistics feels less like a worksheet and more like a tiny data parade.
In work and daily life, mean, median, and mode are also useful for avoiding misleading conclusions. A salary report may show a high average salary, but the median may reveal that most workers earn less than that average. A product review may have an average rating of 4 stars, but the mode might be 5 stars if most people loved it and a few people rated it very low. Looking at more than one measure gives a fuller picture.
The biggest lesson is this: do not treat mean, median, and mode as three separate chores. Treat them as three different camera angles on the same scene. The mean gives you the wide shot, the median gives you the center frame, and the mode shows what appears most often. When you use all three thoughtfully, numbers stop being random clutter and start becoming useful information.
Conclusion
Learning how to find mean, median, and mode is a core statistics skill that makes data easier to understand. The mean shows the average, the median shows the middle, and the mode shows the most frequent value. By following seven simple stepswriting the data clearly, ordering it, calculating the mean, locating the median, handling even-numbered data sets, counting the mode, and comparing the resultsyou can summarize numbers with confidence.
The real power comes from knowing when to use each measure. The mean is great for balanced data, the median is better when outliers appear, and the mode is perfect for finding the most common value. Together, they help you read data more clearly, make better decisions, and avoid being fooled by one lonely number trying to tell the whole story.